Image Details
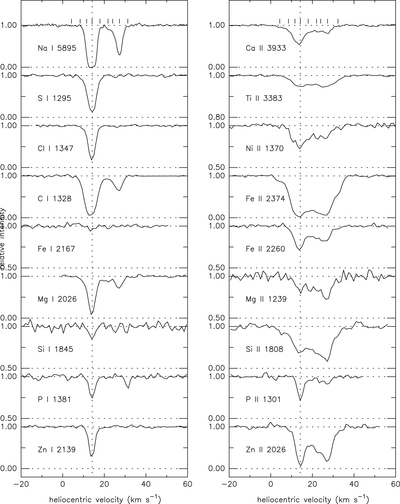
Caption: Figure 2.
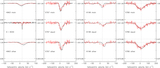
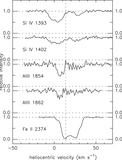
Normalized spectra of selected atomic species toward HD 62542. The UV spectra are from STIS (FWHM ∼ 2.7 km s−1); the optical spectra are from ESO/CES (FWHM ∼ 1.26–2.0 km s−1) or ESO/UVES (FWHM ∼ 6.8 km s−1). On the left are trace neutral species, concentrated in the main narrow component near 14 km s−1 (vertical dotted line). On the right are singly ionized species (dominant ions in predominantly neutral gas), with contributions from components spread over velocities from about 4 to 32 km s−1. Tick marks above the Na I λ5895 and Ca II λ3933 profiles indicate the individual components determined in detailed fits to those profiles. The differences in profile for the dominant species reflect both element-to-element and component-to-component differences in depletions.
Other Images in This Article

Show More
Copyright and Terms & Conditions
© 2020. The American Astronomical Society. All rights reserved.