Image Details
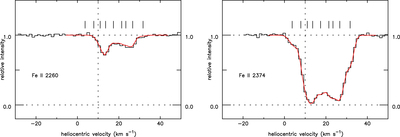
Caption: Figure 4.
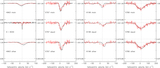
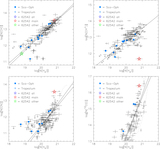
Normalized spectra of the weak λ2260 and strong λ2374 lines of Fe II toward HD 62542. The black histogram is the observed spectrum; the smooth red curve is the adopted fit. The tick marks give the positions of the nine components adopted in the fits (see Table 2).
Other Images in This Article

Show More
Copyright and Terms & Conditions
© 2020. The American Astronomical Society. All rights reserved.
Copyright ©
2024 Astronomy Image Explorer. All Rights Reserved.