Image Details
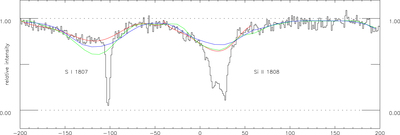
Caption: Figure 1.
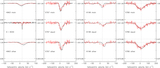
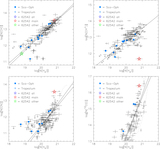
Model stellar spectra and continuum fits near the interstellar S I λ1807 and Si II λ1808 absorption lines toward HD 62542. The black histogram gives the observed spectrum; the blue and green curves give the predicted spectra from Tlusty stellar models with Teff = 18,000 K (log g = 3.75, v sin i = 30 km s−1 in green; log g = 4.25, v sin i = 40 km s−1 in blue), approximately matched in the stellar continuum regions; the red curves give the adopted local continuum fits around the interstellar absorption lines. As the predicted strengths of the stellar absorption lines do not perfectly match the observed line strengths, the model spectra are just taken to constrain the stellar v sin i (∼35 km s−1) and the curvature for “reasonable” fits to the local continua around the interstellar absorption features.
Other Images in This Article

Show More
Copyright and Terms & Conditions
© 2020. The American Astronomical Society. All rights reserved.