Image Details
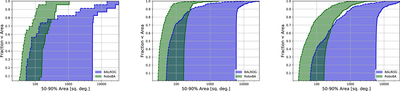
Caption: Figure 6.
Cumulative distributions of the area for the 50%–90% confidence intervals for the public automated localizations (left panel) for RoboBA and BALROG, the bright sample (middle panel), and the full sample (right panel) by applying the corresponding systematics.
Other Images in This Article


Copyright and Terms & Conditions
© 2020. The American Astronomical Society. All rights reserved.
Copyright ©
2025 Astronomy Image Explorer. All Rights Reserved.