Image Details
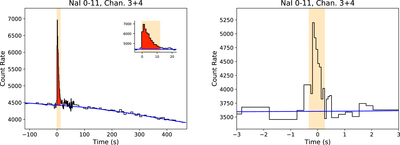
Caption: Figure 1.
RoboBA processing of (left panel) Fermi GBM long GRB 190222537 and (right panel) short GRB 170817A. Shown is the sum of the data from all NaI detectors in the 50–300 keV energy range. The blue line is the background estimate, and the red filled region for the long GRB is identified as containing a significant signal. The orange selection shows the segment of data chosen to perform the localization analysis.
Other Images in This Article


Copyright and Terms & Conditions
© 2020. The American Astronomical Society. All rights reserved.
Copyright ©
2025 Astronomy Image Explorer. All Rights Reserved.