Image Details
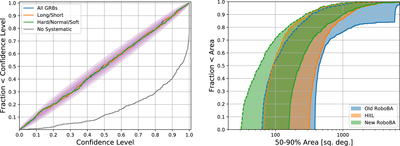
Caption: Figure 3.
Left panel: calibration of the RoboBA systematic as evaluated over 505 GRBs, splitting into long and short GRB samples, and splitting into hard, normal, and soft spectra. The distribution with no systematic is shown for comparison. The purple contours denote the empirical 1σ, 2σ, and 3σ confidence levels for the calibration. Right panel: cumulative distributions of the 50% (dashed line) credible area and 90% (solid line) credible area for the old and new RoboBA and the HitL localizations.
Other Images in This Article


Copyright and Terms & Conditions
© 2020. The American Astronomical Society. All rights reserved.
Copyright ©
2025 Astronomy Image Explorer. All Rights Reserved.