Image Details
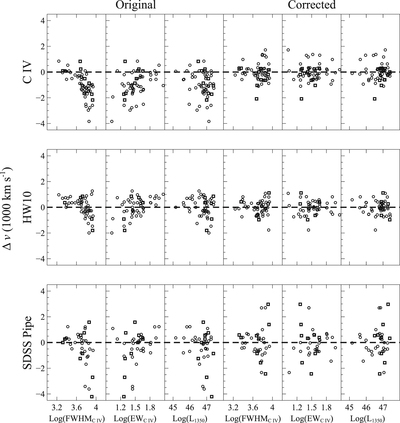
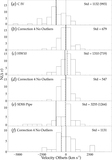
Caption: Figure 4.
The residual velocity offsets with respect to zsys before, three leftmost panels, and after, three rightmost panels, correction are presented against our regression parameters. The corrected method displayed refers to Correction 4 without outliers reported in Table 7. Squares (circles) represent data from M17 (UKIRT; this work). The outliers discussed in Section 3.1 do not appear in this plot given their abnormally large velocity offsets.
Other Images in This Article
Copyright and Terms & Conditions
© 2020. The American Astronomical Society. All rights reserved.
Copyright ©
2025 Astronomy Image Explorer. All Rights Reserved.