Image Details
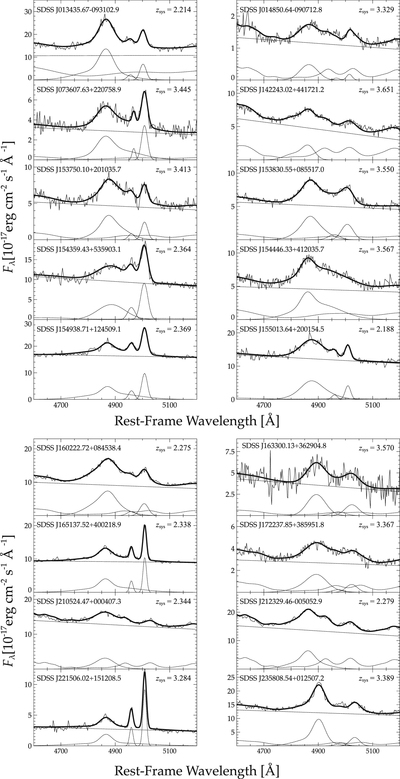
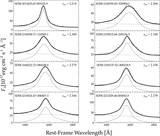
Caption: Figure 1.
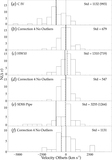
NIR spectra of 2.15 < z < 3.70 quasars. The spectrum in each panel is given by a thin solid line. The fit to each individual feature, Fe II, Hβ, and [O III] where applicable, and the linear continuum are indicated by dashed lines. The overall fit to each spectrum is given by the bold solid line.
Other Images in This Article
Copyright and Terms & Conditions
© 2020. The American Astronomical Society. All rights reserved.
Copyright ©
2025 Astronomy Image Explorer. All Rights Reserved.