Image Details
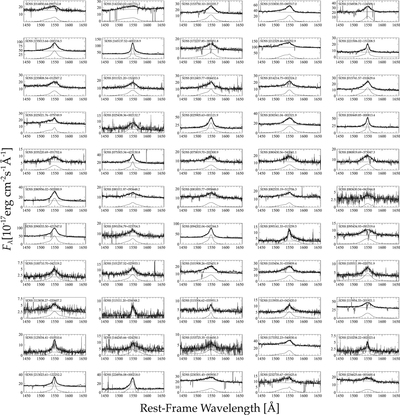
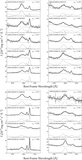
Caption: Figure 3.
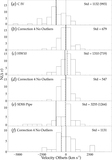
C IV fits of all 55 quasars used in the regression analysis. The spectrum and fit to the C IV emission line in each panel are given by a thin solid line. The linear continuum is indicated by a dashed line. The overall fit to each spectrum is given by the bold solid line.
Other Images in This Article
Copyright and Terms & Conditions
© 2020. The American Astronomical Society. All rights reserved.
Copyright ©
2025 Astronomy Image Explorer. All Rights Reserved.