Image Details
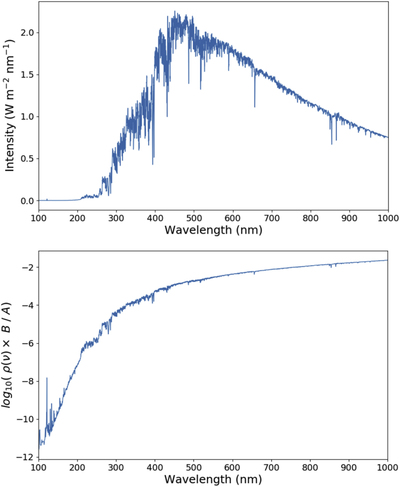
Caption: Figure 8.
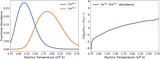
Top: Solar spectral energy density from ISS observations at 1 au (Meftah et al. 2018). Bottom: Relative rate of photoexcitation and spontaneous emission vs. wavelength for any energy level transition based on the energy density from the top curve (scaled to 1 R⊙) as shown in the example in Section 3.2.2. For all visible (and shorter) wavelengths, the rate of spontaneous emission is at least 2 orders of magnitude smaller than photoexcitation.
Other Images in This Article
Show More
Copyright and Terms & Conditions
© 2020. The American Astronomical Society. All rights reserved.
Copyright ©
2025 Astronomy Image Explorer. All Rights Reserved.