Image Details
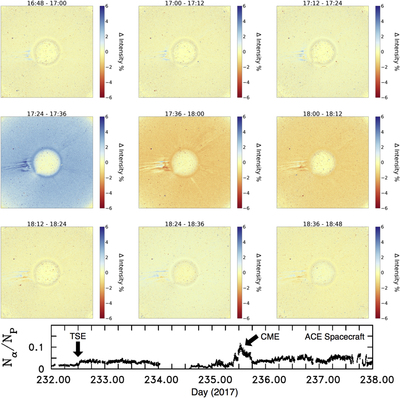
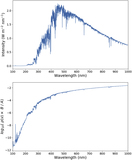
Caption: Figure 4.
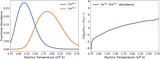
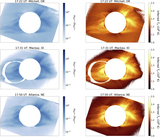
Top: Percentage difference images of LASCO-C2 coronagraph data indicating the total white light continuum intensity changes around the time of the eclipse. There is a substantial increase in emission (>3%) occurring between 17:24 and 17:36, which roughly coincides with the times of totality at Mitchell and Mackay. The increase, and subsequent decrease in emission, is evidence of halo-CME activity during the period of eclipse observations. Bottom: Alpha particle abundance relative to protons in the solar wind at L1 as observed by the ACE spacecraft. Arrows indicate the time of the total solar eclipse (TSE) and the signature of a CME arriving about 3 days after the eclipse.
Other Images in This Article
Show More
Copyright and Terms & Conditions
© 2020. The American Astronomical Society. All rights reserved.