Image Details

Caption: Figure 4.
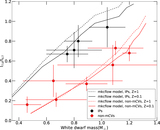
Left panel: MWD derived from I7.0/I6.7 vs. dynamically determined MWD. Right panel: MWD derived from Tmax vs. dynamically determined MWD. The black (red) data points represent IPs (non-mCVs). The solid diagonal lines in both panels show a 1:1 relation for the MWD values. The dashed lines show the best linear fit to the distribution (see Section 4.2 for details).
Other Images in This Article
Copyright and Terms & Conditions
© 2019. The American Astronomical Society.
Copyright ©
2025 Astronomy Image Explorer. All Rights Reserved.