Image Details
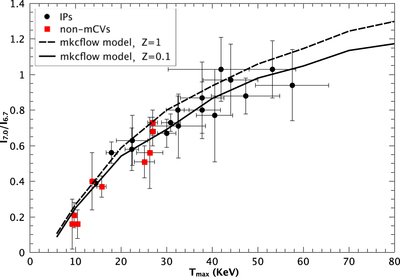
Caption: Figure 2.
I7.0/I6.7 vs. Tmax for sampled CVs. Symbols and lines are as described in the insert. The solid and dashed black curves are the predicted relations by mkcflow models of different metallicities (Z = 0.1 and 1 solar values, respectively).
Other Images in This Article
Copyright and Terms & Conditions
© 2019. The American Astronomical Society.
Copyright ©
2025 Astronomy Image Explorer. All Rights Reserved.