Image Details
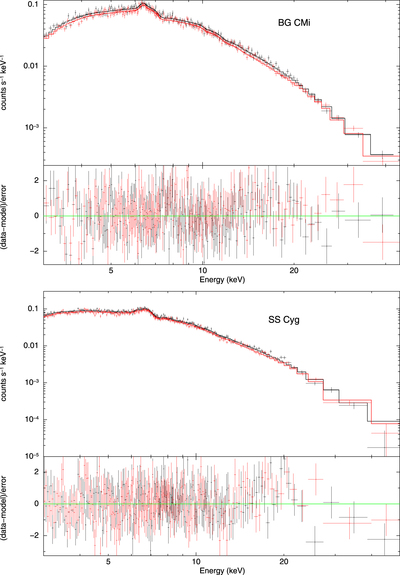
Caption: Figure 1.
Examples of typical 3–50 keV NuSTAR spectra of two CVs, with the best-fitted model of an absorbed mkcflow plus a Gaussian to model the Fe Kα line. The black and red data points represent FPMA and FPMB spectra, respectively. The upper and lower panels are spectra of BG CMi and SS Cyg, respectively. Spectra are rebinned for plotting only.
Other Images in This Article
Copyright and Terms & Conditions
© 2019. The American Astronomical Society.
Copyright ©
2025 Astronomy Image Explorer. All Rights Reserved.