Image Details
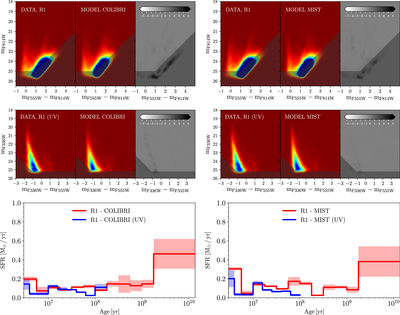
Caption: Figure 9.
Top panels: Hess diagrams of the inner region of NGC 7793 from the V/I data. The observational one is on the left and the one reconstructed on the basis of different sets of models in the middle (COLIBRI models in the left-middle panels, and MIST models in the right-middle panel), while on the right we show the residuals between the two in terms of the likelihood used to compare data and models in SFERA, i.e., ﹩\mathrm{data}\times \mathrm{ln}(\mathrm{data}/\mathrm{model})-\mathrm{data}+\mathrm{model};﹩ the shaded part corresponds to the area below the 50% completeness limit used as a boundary for the SFH recovery. Middle panels: Hess diagrams and residuals between the U/V observational and synthetic CMDs. Bottom panels: recovered V/I SFH in red, U/V SFH in blue, from the two sets of models (COLIBRI on the left, MIST on the right).
Other Images in This Article


Show More
Copyright and Terms & Conditions
© 2019. The American Astronomical Society. All rights reserved.