Image Details
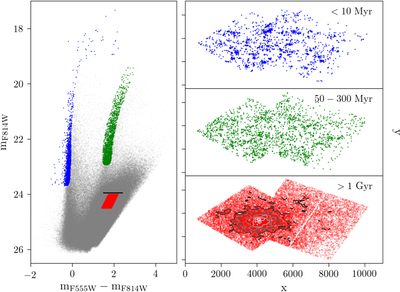
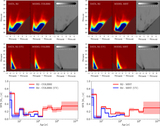
Caption: Figure 4.
Left panel: selection of three different stellar populations in the V/I CMD. In blue, stars with ages <10 Myr; in green, stars with intermediate ages between ∼50 and ∼300 Myr; in red, stars older than 1 Gyr. The horizontal black line represents the magnitude of the RGB tip. Right panels: spatial distribution of the age-selected stars. Overplotted in gray scale on the oldest stars (bottom map), we show some isodensity contours to highlight the elliptical halo of the galaxy and the central lower density caused by incompleteness.
Other Images in This Article


Show More
Copyright and Terms & Conditions
© 2019. The American Astronomical Society. All rights reserved.
Copyright ©
2025 Astronomy Image Explorer. All Rights Reserved.