Image Details

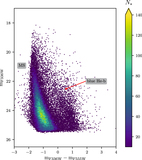
Caption: Figure 2.
V/I color–magnitude diagram (after the quality cuts) of the two fields of NGC 7793 covered by WFC3 and ACS imaging. The high-density regions have been binned and color-coded by number density (see the color-scale bar on the right of each panel) for a better visualization of the evolutionary features in the diagram. The main stellar evolutionary phases are indicated (see Section 3). The horizontal white line represents the magnitude of the red giant branch tip.
Other Images in This Article


Show More
Copyright and Terms & Conditions
© 2019. The American Astronomical Society. All rights reserved.
Copyright ©
2025 Astronomy Image Explorer. All Rights Reserved.