Image Details
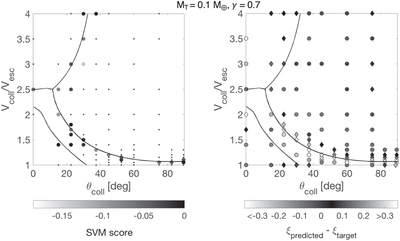
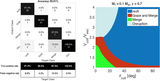
Caption: Figure 7.
Left-hand panel: local SVM score of the SPH simulations by the classifier of collision outcomes (small dots: correct predictions; color-coded data points: misclassifications). Right-hand panel: residuals between the predictions by the regressor and the SPH data, for the same combination of mass of the target and mass of the projectile (diamonds: positive residuals; dots: negative residuals). Impact velocity ranges between 1 and 4 times the mutual escape velocity, impact angle ranges from head-on to grazing, MT = 0.1 M⊕ and γ = MP/MT = 0.7. High uncertainty is recorded along the decision boundaries (black curves), where misclassifications and inaccurate predictions tend to cluster. In these regions, additional SPH simulations are required to further reduce the confusion of the ML algorithms.
Other Images in This Article
Copyright and Terms & Conditions
© 2019. The American Astronomical Society. All rights reserved.