Image Details
Caption: Figure 1.
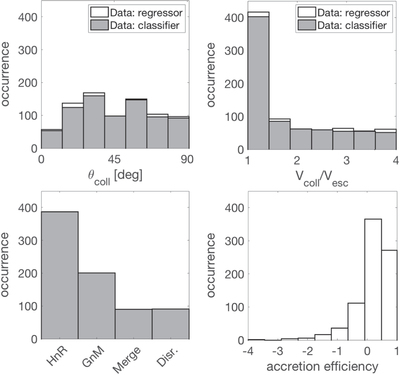
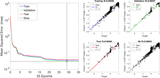
Top left-hand and top right-hand panels: frequency distributions of input impact angle θcoll and velocity vcoll/vesc, respectively; the values for the other two input parameters that are present in the dataset—target mass and mass ratio (projectile/target)—are provided in Table 1. Bottom left-hand panel: frequency distribution of the collision classes as labeled in the classification task (Sections 2.2.1 and 3.1); on the x-axis, HnR refers to the simulations labeled as hit-and-run cases, GnM refers to the graze-and-merge cases, and Disr. refers to the disruption cases. Bottom right-hand panel: frequency distribution of accretion efficiency values—Equation (11)—which are used in the regression task (Sections 2.2.2 and 3.2). The simulations come from Reufer (2011). Further details on the database of simulations and detailed physical analysis are provided in Gabriel et al. (2019).
Other Images in This Article
Copyright and Terms & Conditions
© 2019. The American Astronomical Society. All rights reserved.