Image Details
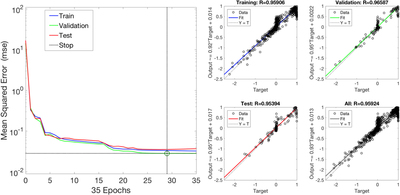
Caption: Figure 5.
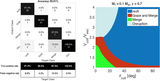
Left-hand panel: evolution of the Mean Square Error (MSE) for training, testing and validation, for increasing epochs of training. When validation is concluded, the average plateau value of the testing MSE is 0.04. This quantifies the global uncertainty of the surrogate model in mimicking the parent numerical model; i.e., the SPH simulations. Right-hand panel: correlation between predictions and target, and overall fitting with respect to an expected 1:1 line. The regression index R is about 96% (average), close to the optimal value of 100%.
Other Images in This Article
Copyright and Terms & Conditions
© 2019. The American Astronomical Society. All rights reserved.
Copyright ©
2025 Astronomy Image Explorer. All Rights Reserved.