Image Details
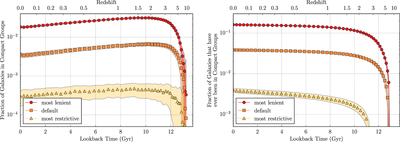
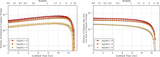
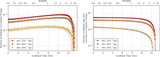
Caption: Figure 5.
Same as Figure 3, but varying all three parameters. The “most lenient” curve (red circles) is generated using a neighborhood parameter NH = 75 ﹩{h}^{-1}﹩ kpc, a maximum shell density ratio ﹩{\mathrm{log}}_{10}({\rm{SR}})=-3﹩, and a mass ratio MR = 0.05. The “default” curve (orange squares) with values chosen to best approximate the HCG sample is the result using our “default” values of NH = 50 ﹩{h}^{-1}﹩ kpc, ﹩{\mathrm{log}}_{10}({\rm{SR}})=-4﹩, and MR = 0.10. The “most restrictive” curve (yellow triangles) is the result using NH = 25 ﹩{h}^{-1}﹩ kpc, ﹩{\mathrm{log}}_{10}({\rm{SR}})=-5﹩, and MR = 0.20. The width of the shaded region is 50 times the Poisson uncertainty. The specific input criteria for the clustering algorithm are clearly important in determining the normalization of the curves, but their shapes in both panels are similar with CG galaxy number peaking at z ∼ 1.7.
Other Images in This Article
Copyright and Terms & Conditions
© 2019. The American Astronomical Society. All rights reserved.