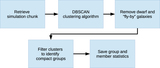
Image Details
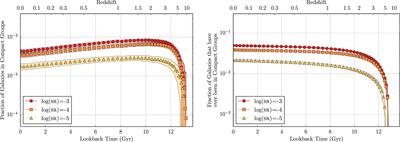
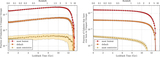
Caption: Figure 4.
Same as Figure 3, but varying the maximum shell density ratio. Each analysis uses a neighborhood parameter NH = 50 ﹩{h}^{-1}﹩ kpc and a minimum mass ratio MR = 0.10. These curves are the results of varying the maximum shell density ratio (﹩\mathrm{log}({\rm{SR}})=-3﹩, red circles; ﹩\mathrm{log}({\rm{SR}})=-4﹩, orange squares; ﹩\mathrm{log}({\rm{SR}})=-5﹩, yellow triangles). The width of the shaded region is 50 times the Poisson uncertainty. Though the overall shapes of the curves are similar to those in Figure 3, varying the values of SR by two orders of magnitude did not produce as strong of an effect as varying MR by a factor of 4. A restrictive SR value of −5 (indicating very isolated systems) led to the fewest CG galaxies at all redshifts.
Other Images in This Article
Copyright and Terms & Conditions
© 2019. The American Astronomical Society. All rights reserved.