Image Details

Caption: Figure 12.
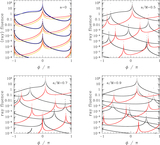
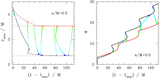
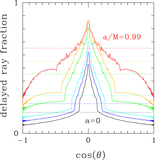
Red curve: rms variation in the linear polarization angle of the prompt electromagnetic pulse, as seen by an observer positioned at a fixed latitude but random orbital phase relative to the emission point. Black curve: rms ϕ component of the electric vector, also averaged over the angle ϕ of emission. Polarization variance is minimized where detection volume is maximized (Figure 11).
Other Images in This Article
Show More
Copyright and Terms & Conditions
© 2019. The American Astronomical Society. All rights reserved.
Copyright ©
2025 Astronomy Image Explorer. All Rights Reserved.