Image Details
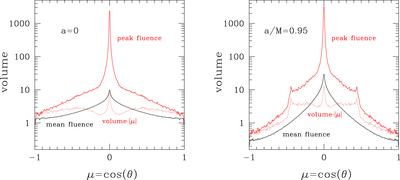
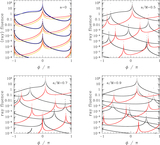
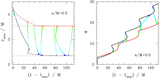
Caption: Figure 11.
Normalized euclidean volume V corresponding to a fixed threshold pulse fluence, as detected by an observer at fixed BH latitude. Black curve: fluence is averaged over successive pulses emitted at random orbital phase with respect to the observer. Red curve: volume corresponding to the peak fluence detected at a given latitude. The cutoff in volume (and fluence) at μ = 0 is an artifact of the finite size of the angular grid used to map outgoing rays. Dotted curve: differential volume V · μ. Left panel: a = 0; right panel: a/M = 0.95.
Other Images in This Article
Show More
Copyright and Terms & Conditions
© 2019. The American Astronomical Society. All rights reserved.
Copyright ©
2025 Astronomy Image Explorer. All Rights Reserved.