Image Details
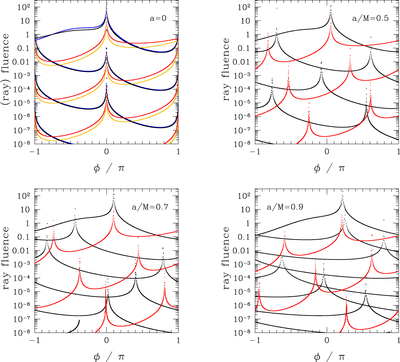
Caption: Figure 4.
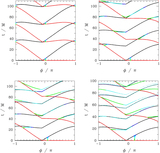
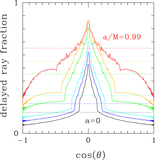
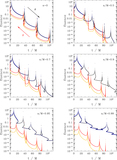
Black and red curves: ray fluence vs. azimuth, as measured on the equatorial plane of the BH at null infinity. BH spin increases from the top left. Blue and gold curves: corresponding energy fluence after weighting by the energy integral (11). First pulse detected by an observer sitting at angle ϕ corresponds to the top black/blue curve to the left of the top caustic, and the top red/gold curve to the right. Successive pulses of diminishing fluence are emitted at increasing times; see also Figure 10. When a > 0, the successive caustics shift in angle because of the differing periods of the prograde and retrograde light rings and the transit times of polar rays. These curves are obtained by integrating the Raychaudhuri Equations (17) for a large number of equatorial rays. In the cases with higher spins, the contribution from polar wavefronts connecting the caustic points is missing (see Figure 7).
Other Images in This Article
Show More
Copyright and Terms & Conditions
© 2019. The American Astronomical Society. All rights reserved.