Image Details
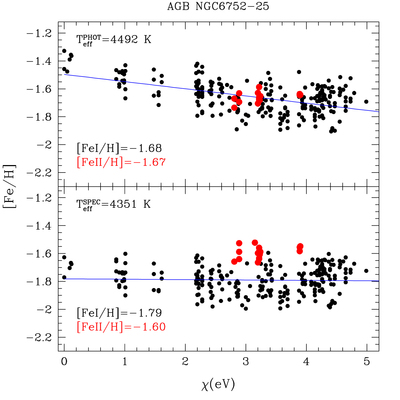
Caption: Figure 6.
Behavior of the iron abundances as a function of the excitation potential, χ, for the AGB star #25, in the case of the photometric Teff adopted by C17 (upper panel) and of the spectroscopic Teff derived by L16 (lower panel). The black circles are for the abundances derived from neutral Fe lines and the red circles are for the single ionized Fe lines. The blue lines are the best linear fits obtained to the Fe I abundances.
Other Images in This Article
Copyright and Terms & Conditions
© 2019. The American Astronomical Society. All rights reserved.
Copyright ©
2025 Astronomy Image Explorer. All Rights Reserved.