Image Details
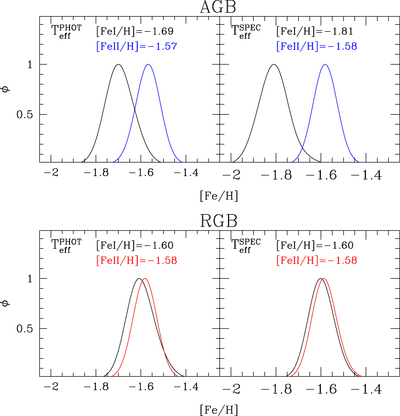
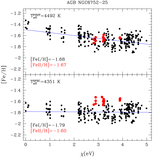
Caption: Figure 2.
[Fe/H] distributions for the AGB and RGB samples (upper and lower panels, respectively) as derived from Fe I (black histograms) and Fe II lines (blue and red histograms). The left panels show the [Fe/H] distributions obtained with the photometric Teff scale used by C17, while the right panels display those obtained with the spectroscopic Teff.
Other Images in This Article
Copyright and Terms & Conditions
© 2019. The American Astronomical Society. All rights reserved.
Copyright ©
2025 Astronomy Image Explorer. All Rights Reserved.