Image Details

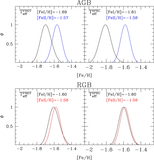
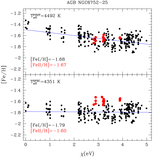
Caption: Figure 1.
Difference between spectroscopic and photometric Teff as a function of the photometric Teff for AGB and RGB samples (upper and lower panel, respectively). The blue solid lines mark the average difference values, which are also labeled in each panel.
Other Images in This Article
Copyright and Terms & Conditions
© 2019. The American Astronomical Society. All rights reserved.
Copyright ©
2025 Astronomy Image Explorer. All Rights Reserved.