Image Details
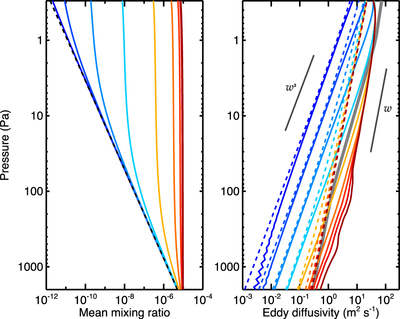
Caption: Figure 5.
Vertical profiles of the global-mean volume mixing ratio (left) and derived effective eddy diffusivity (right) from Experiment I. Different colors from cold (blue lines) to warm (red lines) represent tracers with different chemical timescales from short to long, ranging from 107 s to 1011 s. The prescribed equilibrium tracer mixing ratio profile is shown in the dashed line in the left panel, which is nearly on top of the mixing ratio profile of the very short-lived tracer (dark blue solid line, see the upper left corner of the left panel). The predicted eddy diffusivity profiles based on Equation (23) are shown by dashed lines in the right panel. The solid lines are derived from the simulations. The thick gray line indicates the empirical eddy diffusivity profile used in current photochemical models in Jupiter’s stratosphere (Moses et al. 2005, Moses & Poppe 2017).
Other Images in This Article


Copyright and Terms & Conditions
© 2018. The American Astronomical Society. All rights reserved.