Image Details
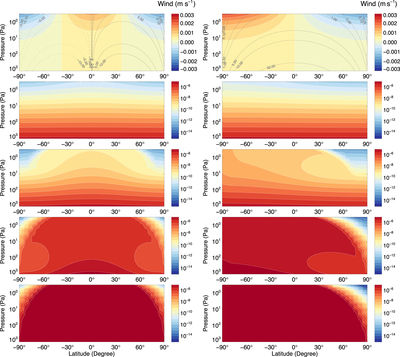
Caption: Figure 4.
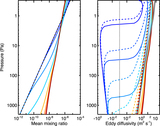
Latitude–pressure maps of experiments I (left) and II (right). First row: vertical winds (color) and mass streamfunctions (contours, in units of ﹩{10}^{13}\,\mathrm{Kg}\,{{\rm{s}}}^{-1}﹩). Starting from the second row we show volume mixing ratio maps of tracers with chemical timescales of 107 s, 108 s, 109 s, and 1010 s from top to the bottom, respectively.
Other Images in This Article


Copyright and Terms & Conditions
© 2018. The American Astronomical Society. All rights reserved.
Copyright ©
2025 Astronomy Image Explorer. All Rights Reserved.