Image Details
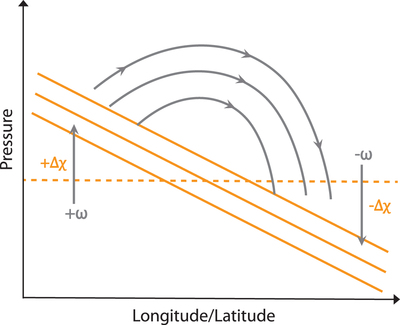
Caption: Figure 2.
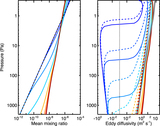
Illustration of tracer transport with a large-scale circulation. The orange solid lines indicate constant tracer mixing ratio surfaces. The tracer mixing ratio is higher in the lower atmosphere. Gray lines show horizontal and vertical wind transport with vertical velocity w. Δχ is the deviation of local tracer mixing ratio from the horizontally averaged mixing ratio on an isobar (dashed).
Other Images in This Article


Copyright and Terms & Conditions
© 2018. The American Astronomical Society. All rights reserved.
Copyright ©
2025 Astronomy Image Explorer. All Rights Reserved.