Image Details
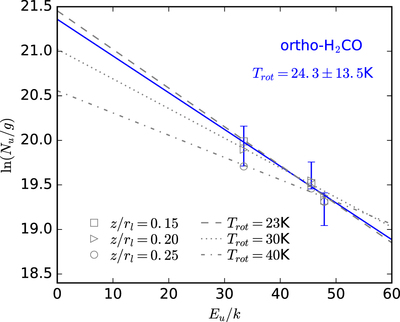
Caption: Figure 3.
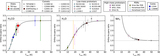
Rotational diagram for ﹩{\rm{o}} \mbox{-} {{\rm{H}}}_{2}\mathrm{CO}﹩. The blue error bars and solid line correspond to the observations and the gray markers and lines show the best-fit models for the three different lower boundaries considered (see Section 4).
Other Images in This Article
Copyright and Terms & Conditions
© 2018. The American Astronomical Society. All rights reserved.
Copyright ©
2025 Astronomy Image Explorer. All Rights Reserved.