Image Details
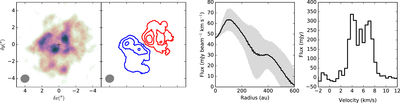
Caption: Figure 1.
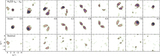
ALMA observations of the ﹩{\rm{p}} \mbox{-} {{\rm{H}}}_{2}\mathrm{CO}﹩ ﹩{4}_{04}\mbox{--}{3}_{03}﹩ line. The two left panels show velocity integrated maps over the full line and over the red- and blue-shifted parts of the line. The beam is shown in the bottom left corner. Contours correspond to 3, 7, 10, 20× rms, where the rms is given in the last column of Table 1. The third panel shows the deprojected radial profile of the emission computed by azimuthally averaging the emission. The gray shaded region shows the standard deviation at each radius. The last panel shows the spectra integrated over the disk.
Other Images in This Article
Copyright and Terms & Conditions
© 2018. The American Astronomical Society. All rights reserved.
Copyright ©
2024 Astronomy Image Explorer. All Rights Reserved.