Image Details
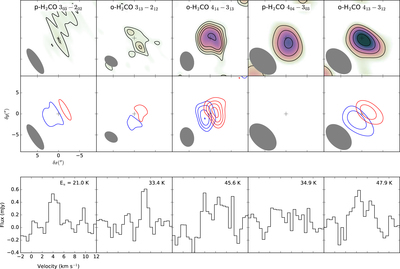
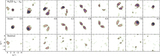
Caption: Figure 2.
SMA observations of the ortho and para ﹩{{\rm{H}}}_{2}\mathrm{CO}﹩ lines. The top row show the velocity integrated line emission. The second row shows the red and blueshifted parts of the emission. Contour levels correspond to 3, 7, 10, 20× rms, where the rms is given in Table 1. The disk-integrated spectra is shown in the bottom row.
Other Images in This Article
Copyright and Terms & Conditions
© 2018. The American Astronomical Society. All rights reserved.
Copyright ©
2024 Astronomy Image Explorer. All Rights Reserved.