Image Details
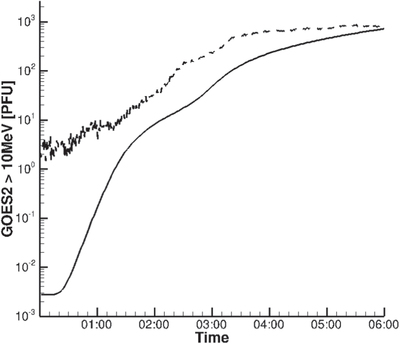
Caption: Figure 4.
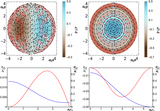
Time evolution of simulated flux of SEPs exceeding 10 MeV (GOES channel 2) at 1 au on a single line (solid black line) compared to GOES measurements (dashed black line). Time is measured from the CME initiation (4:00 on 2012 January 23).
Other Images in This Article
Copyright and Terms & Conditions
© 2018. The American Astronomical Society. All rights reserved.
Copyright ©
2025 Astronomy Image Explorer. All Rights Reserved.