

Image Details
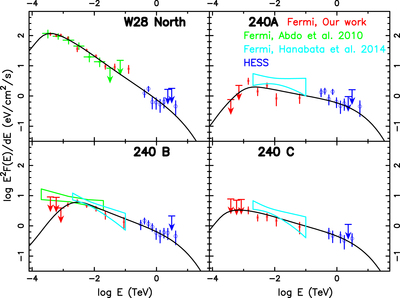
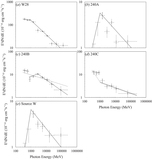
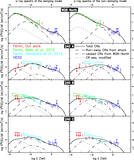
Caption: Figure 6.
Observational γ-ray spectra of W28. Fermi-LAT observations in/around W28 from our work and previous work (Abdo et al. 2010; Hanabata et al. 2014) are shown in red, green, and cyan, respectively. The HESS data points from Aharonian et al. (2008) are marked in blue. Assuming a simple power-law CR population at each target MC clump, the pre-model fitting results are shown as black lines.
Other Images in This Article
Copyright and Terms & Conditions
© 2018. The American Astronomical Society. All rights reserved.

Copyright ©
2026 Astronomy Image Explorer. All Rights Reserved.
