

Image Details
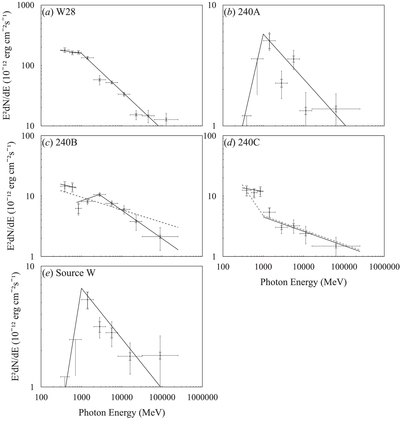
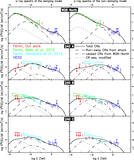
Caption: Figure 5.
0.3–250 GeV SEDs. In panels (a), (b), and (e), the solid lines indicate the best-fit BKPL models. In panels (c) and (d), solid lines show models with discontinuous flux, and gray dashed lines show models with continuous flux. Statistic uncertainties are plotted in black, and systematic uncertainties are plotted in gray. The systematic uncertainties consist of two parts: (i) the differences when varying the Galactic diffuse emission by ±5%, and (ii) https://fermi.gsfc.nasa.gov/ssc/data/analysis/scitools/Aeff_Systematics.html. The uncertainties on the LAT effective area.
Other Images in This Article
Copyright and Terms & Conditions
© 2018. The American Astronomical Society. All rights reserved.

Copyright ©
2026 Astronomy Image Explorer. All Rights Reserved.
