Image Details
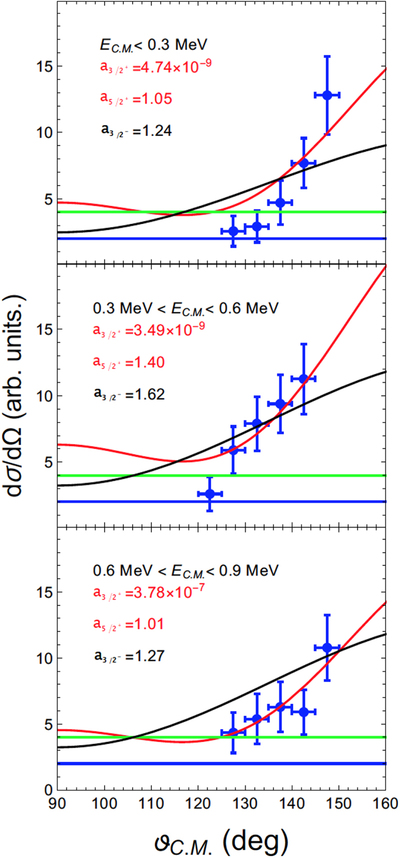
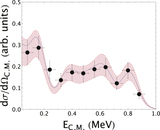
Caption: Figure 9.
Experimental angular distribution for the 19F(α, p)22Ne reaction (﹩\tfrac{d\sigma }{d{\rm{\Omega }}}﹩ vs. ϑC.M, where ϑC.M is the emission angle of the proton in the center-of-mass reference frame of the reaction). The blue solid circles are the present experimental data. The red line represents a fit to the experimental data done by means of a linear combination of Jπ = 3/2+ and Jπ = 5/2+ angular distributions, using the equations given in Blatt & Biedenharn (1952) and La Cognata et al. (2015). The black, green, and blue lines are instead angular distributions for Jπ equal to 3/2−(with ﹩{{\rm{a}}}_{3/{2}^{-}}﹩ as normalization coefficient), 1/2+, and 1/2− (multiplied by a factor of two to separate it from the preceding distribution). See the text for details.
Other Images in This Article
Show More
Copyright and Terms & Conditions
© 2018. The American Astronomical Society. All rights reserved.