Image Details
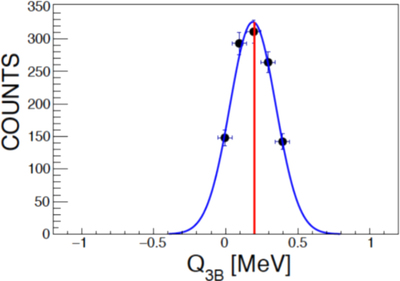
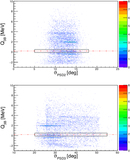
Caption: Figure 5.
Q-value spectrum for the 6Li(19F, p22Ne)d reaction. A Gaussian fit to the experimental data is also reported with the blue line, while the red one shows the position of the theoretical Q-value. Errors along the y-axis represent the statistical error, while those along the x-axis are calculated by means of standard error propagation, considering the errors on energy and angle measurement of PSDs.
Other Images in This Article
Show More
Copyright and Terms & Conditions
© 2018. The American Astronomical Society. All rights reserved.
Copyright ©
2026 Astronomy Image Explorer. All Rights Reserved.