Image Details
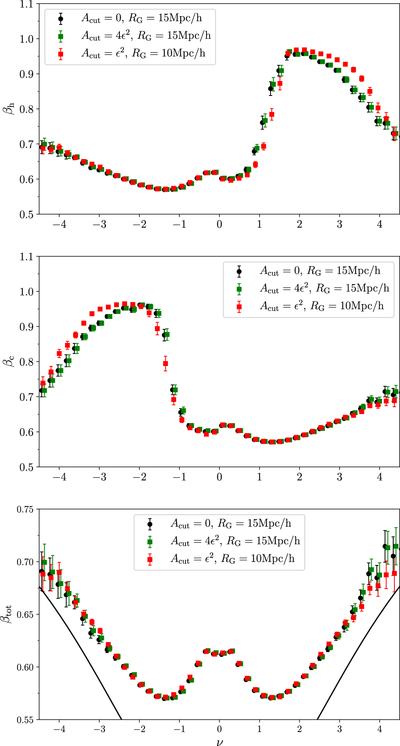
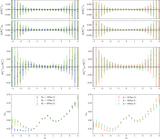
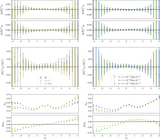
Caption: Figure 8.
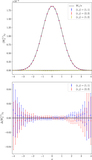
Statistic β for holes and connected regions (top and middle panels) and the combined mean of both holes and connected excursion regions (bottom panel). The black circles and green squares indicate the mean value of this statistic after we have made different cuts to our sample of connected regions and holes (according to the size of the region) for a fixed smoothing scale ﹩{R}_{{\rm{G}}}=15\,{h}^{-1}\,\mathrm{Mpc}﹩. We note that the statistic is insensitive to these cuts. The red squares are the same statistic with a smaller smoothing scale ﹩{R}_{{\rm{G}}}=10\,{h}^{-1}\,\mathrm{Mpc}﹩ applied. In this case, the percolation of the field occurs at a slightly different value of ν, but the statistics behave similarly otherwise. We also exhibit the theoretical prediction (Equation (18)) obtained using peak statistics as a solid black curve in the bottom panel. The theoretical curve approaches our numerical result for high threshold values.
Other Images in This Article
Show More
Copyright and Terms & Conditions
© 2018. The American Astronomical Society. All rights reserved.