Image Details
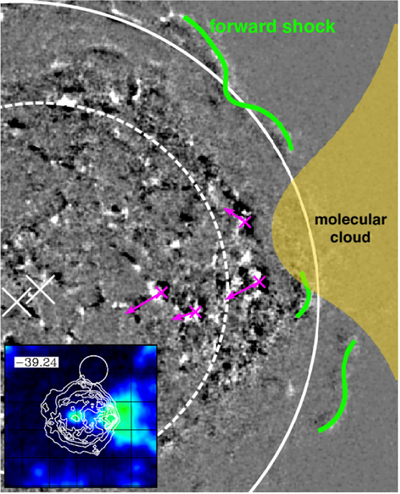
Caption: Figure 8.
Schematic diagram of the shock–cloud interaction. The image show the same image as in Figure 1(a). Magenta arrows show the proper-motion directions of the inward shocks. The forward shocks are emphasized by thick green lines. Small and large circles indicate the radii of the reverse shock and forward shock (Gotthelf et al. 2001), respectively. Cross marks show the center positions of each circle. The center of the reverse-shock circle offsets to the northeast direction. The small screen set on left bottom shows the CO map with the velocity of −39.24 km s−1 in Kilpatrick et al. (2014). A distance between the reverse shock and the forward shock is ∼0.7 pc at the western region.
Other Images in This Article
Copyright and Terms & Conditions
© 2018. The American Astronomical Society. All rights reserved.