Image Details

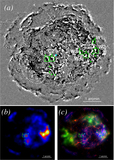
Caption: Figure 2.
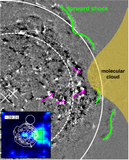
Left side: X-ray images overlaid with proper-motion vectors obtained by the optical-flow method, where the energy ranges are (a) a continuum band of 4.1–6.3 keV and (b) a Si–K band of 1.7–2.1 keV. For the optical-flow analysis, we used images taken in 2004 (ObsID. 5320) and 2014 (ObsID. 14481). The vector length is proportional to the actual shifting value. Blue and red show outward and inward motions, respectively. In these figures, small vectors whose proper motion is ≲0.05 arcsec yr−1 are not shown. The field of view is 450 × 450 pixels (=3.′69 × 3.′69). The center of the field of view, (x, y) = (225, 225), is the CCO location. The unit of the color bar is 10−7 counts cm−2 s−1. Contours overlaid on the continuum and Si–K band images show 1, 5, 10, 15, 20 × 10−7 counts cm−2 s−1 and 3, 15, 30, 45, 60 × 10−7 counts cm−2 s−1, respectively. Right side: length of radial component of proper-motion vectors are shown in color maps in the continuum band (a′) and the Si–K band (b′). Positive and negative values correspond to outward and inward motions, respectively. The unit of the color scale is arcsec yr−1. A proper motion of 0.15 arcsec yr−1 corresponds to ∼2400 km s−1 at the distance of 3.4 kpc.
Other Images in This Article
Copyright and Terms & Conditions
© 2018. The American Astronomical Society. All rights reserved.