Image Details
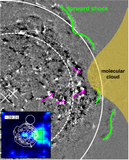
Caption: Figure 1.
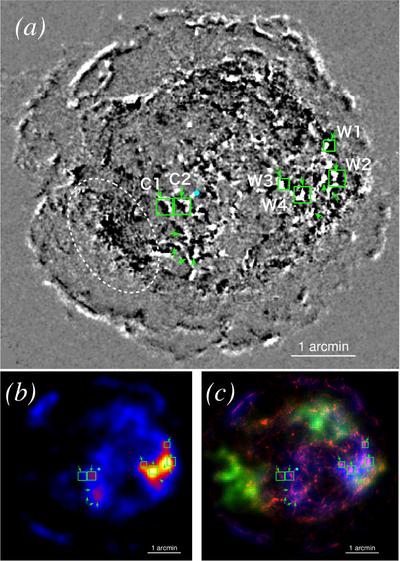
(a) Image difference in the 4.2–6 keV band of Cassiopeia A between 2000 and 2014 with Chandra. Adjacent black and white features show transverse motions of X-ray structures. Green arrows and boxes show the inward-shock positions defined by eye and the regions that were used for the proper-motion measurements. The boxes are identified by name (e.g., C1, W1) The box sizes are 21 × 21 pixels (1 pixel = 0.″492) for W1 and W3, and 31 × 31 pixels for C1, C2, W2, and W4, respectively. (b) The NuSTAR image in 15–40 keV band. Green arrows and boxes show the same as shown in the panel (a). (c) Three-color image of Cassiopeia A. Red, green, and blue colors show the 4.2–6 keV image with Chandra, the 6.54–6.92 keV image (around Fe–K emission) with Chandra, and the 15–40 keV image with NuSTAR, respectively. The binning sizes for the 4.2–6 keV (Chandra), 6.54–6.92 keV (Chandra), and 15–40 keV (NuSTAR) images are 1 × 1 pixels (0.″492 × 0.″492), 8 × 8 pixels (3.″936 × 3.″936), and 1 × 1 pixels (12.″3 × 12.″3), respectively. The images were then smoothed with a Gaussian function with a sigma of three bins. Green arrows and boxes show the same as shown in the panel (a). The cyan dot shows the position of the CCO.
Other Images in This Article
Copyright and Terms & Conditions
© 2018. The American Astronomical Society. All rights reserved.