Image Details
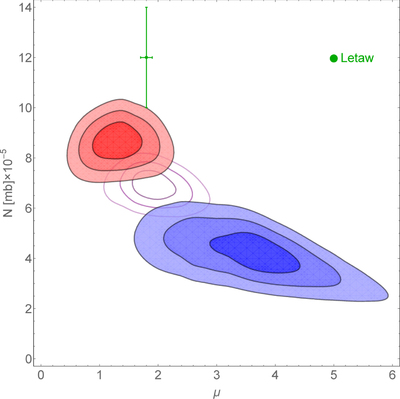
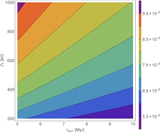
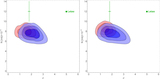
Caption: Figure 4.
Contour plot of ﹩{\chi }^{2}﹩ for the spiral-arms model. Similar to Figures 2 and 3, the red contours correspond to the 51V/51Cr fit, the blue contours correspond to the 49Ti/49V fit, and the dashed purple lines correspond to the combined ﹩{\chi }^{2}﹩ calculation. Note the discrepancy between the two observations is somewhat larger, but still similar in size to the disk-like model.
Other Images in This Article

Copyright and Terms & Conditions
© 2017. The American Astronomical Society. All rights reserved.
Copyright ©
2025 Astronomy Image Explorer. All Rights Reserved.