Image Details
Caption: Figure 2.
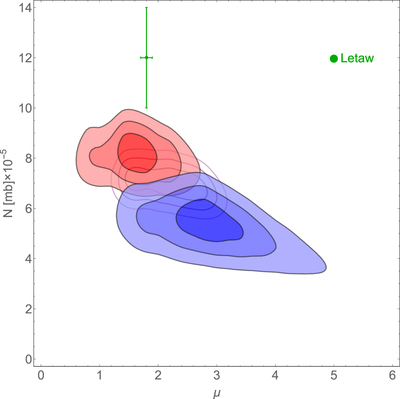
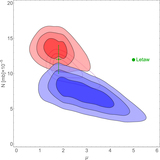
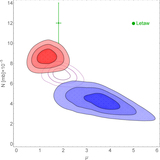
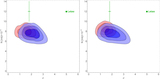
Contour plot of ﹩{\chi }^{2}﹩ fit for a disk-like model with halo size of ﹩{z}_{{\rm{h}}}=1\,\mathrm{kpc}﹩ and diffusion coefficient of ﹩{D}_{0}=4\times {10}^{27}﹩ cm2 s−1. The red contours correspond to the 51V/51Cr fit, the blue contours correspond to the 49Ti/49V fit, and the dashed purple lines correspond to the combined ﹩{\chi }^{2}﹩ calculation. Note the discrepancy between the 51V/51Cr and the 49Ti/49V fits: while the observation for 51V/51Cr requires high normalization and a low power-law index, the observation for 49Ti/49V requires a smaller normalization and a higher power-law index. The green point denotes the electron attachment cross section derived by Letaw et al. (1985), based on the lab measurements of Crawford (1979) and Wilson (1978), which is required to explain experimental data.
Other Images in This Article
Copyright and Terms & Conditions
© 2017. The American Astronomical Society. All rights reserved.