Image Details
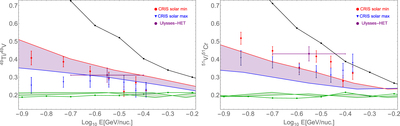
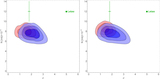
Caption: Figure 1.
49Ti/49V (left panel) and 51V/51Cr (right panel) ratios obtained in our nominal model (black lines) with the set of parameters described in Table 1, and the attachment parameters obtained from the fit described in Section 4.4. The shaded regions correspond to the spectrum once solar wind modulation is added, with the red lines describing the minimum solar modulation while the blue describe the maximum solar modulation. The green lines are the respective lines obtained when the EC isotopes are assumed to be entirely stable. Data taken from CRIS (Niebur et al. 2003) and Ulysses-HET (Connell 1999).
Other Images in This Article

Copyright and Terms & Conditions
© 2017. The American Astronomical Society. All rights reserved.
Copyright ©
2025 Astronomy Image Explorer. All Rights Reserved.