Quasi-electrostatic Whistler Wave Dynamics in Earth’s Radiation Belt
Authors: Sanjay Kumar, R. P. Sharma, Y.-J. Moon, and Ravinder Goyal
2017 The Astrophysical Journal85149.
Provider: AAS Journals
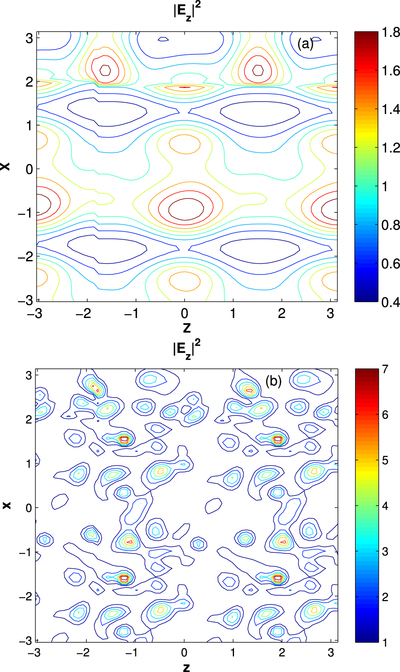
Caption: Figure 2.
(a)--(b). This figure shows the contour plots of ﹩| {E}_{{\rm{y}}}{| }^{2}﹩ at different times, i.e., Figure 2(a) at t = 5 and Figure 2(b) at t = 23, respectively. The distribution of thin sheets and their variation with times are shown here.