Image Details
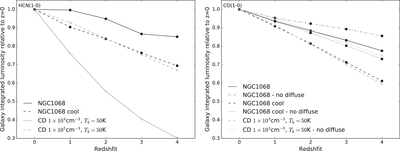
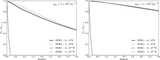
Caption: Figure 5.
Galaxy integrated line luminosities, relative to those at z = 0, as functions of redshift for the toy models. Left: HCN(1−0). Right: CO(1−0). The loss of contrast against the CMB is evident even for the NGC 1068 analogue. In both subplots the constant density model (CD) is also plotted in gray with crosses.
Other Images in This Article

Copyright and Terms & Conditions
© 2017. The American Astronomical Society. All rights reserved.
Copyright ©
2025 Astronomy Image Explorer. All Rights Reserved.