Image Details
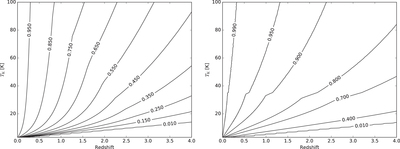
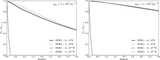
Caption: Figure 2.
Contour plots of the ratio of the HCN(1−0) line brightness at the indicated redshift and at z = 0 for given gas kinetic temperatures for ﹩{\bar{n}}_{{{\rm{H}}}_{2}}=1\times {10}^{4}﹩ cm−3 (left) and ﹩{\bar{n}}_{{{\rm{H}}}_{2}}=1\times {10}^{5}﹩ cm−3 (right), calculated using RADEX. Plotting against the kinetic temperature allows us to incorporate the effect of the CMB on the line excitation temperature. The effect of the CMB is far less pronounced in the higher density plot, where the higher collisional excitation rate drives the line excitation temperature closer to the kinetic temperature of the gas. In these plots, the CMB temperature at a given redshift is approximately equal to the 0.01 contour.
Other Images in This Article

Copyright and Terms & Conditions
© 2017. The American Astronomical Society. All rights reserved.