Image Details
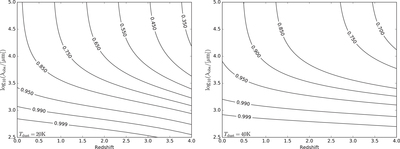
Caption: Figure 3.
Contour plots of the observable fraction of the dust as functions of redshift and the observed wavelength, for a dust temperature of 20 K (left) and 40 K (right). Contour levels are indicated in the plots. The contours are calculated using Equation (18) from da Cunha et al. (2013; see also their Figure 3), and indicate the difference between the intrinsic dust brightness temperature and that of the CMB, normalized by that intrinsic dust brightness temperature.
Other Images in This Article

Copyright and Terms & Conditions
© 2017. The American Astronomical Society. All rights reserved.
Copyright ©
2025 Astronomy Image Explorer. All Rights Reserved.